
Marketing


Vsevolod Hryhorenko
CMO & Co-founder
A Number That Looks Like Success
ROAS is the metric e-commerce brands trust most, and it's the one that misleads them most often. The logic feels airtight: return on ad spend tells you how much revenue each advertising dollar generates, so a high ROAS means advertising is working. A 4× ROAS sounds like a healthy business. A 6× ROAS sounds like a great one.
But ROAS measures revenue, not profit — and those are very different things. A brand can run a 5× ROAS and lose money on every order. The dashboard stays green while the bank balance drifts down, and because the headline number looks strong, the problem goes undiagnosed for months. The brand keeps scaling the campaigns that report the best ROAS, which often means scaling the orders that are quietly the least profitable. This is one of the most common and most expensive misunderstandings in e-commerce advertising, and it traces back to treating a revenue ratio as if it were a profitability measure.
What ROAS Leaves Out
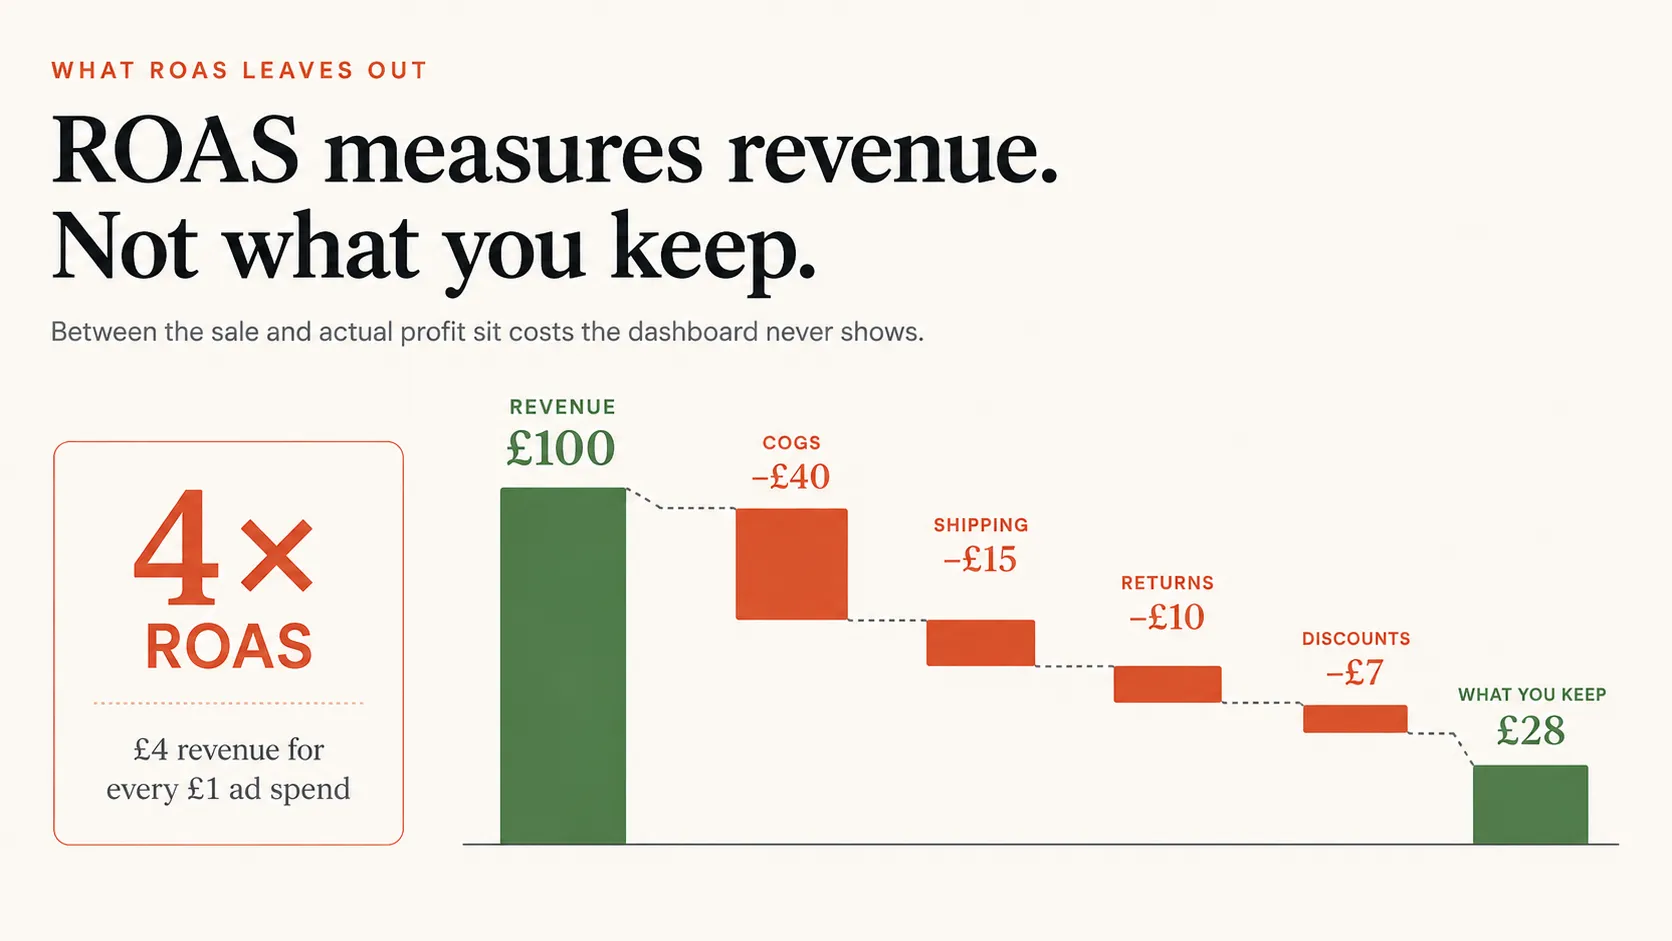
To understand why a strong ROAS can coexist with a shrinking business, you have to look at everything that sits between revenue and actual profit — none of which ROAS accounts for.
A 4× ROAS means £4 of revenue for every £1 of ad spend. That sounds like £3 of profit. It isn't. Out of that £4 comes the cost of the product itself, the cost of shipping and fulfilment, payment processing fees, returns and refunds, and the overhead of running the business. By the time those are subtracted, a 4× ROAS that looked like comfortable profit can be break-even — or a loss.
The numbers that determine whether an order is actually profitable include:
Cost of goods sold (COGS). A product that sells for £50 but costs £20 to make has already consumed half the revenue before any other expense. A brand with 60% COGS needs a dramatically higher ROAS to break even than a brand with 20% COGS — which means there is no universal "good" ROAS. It depends entirely on margin.
Fulfilment and shipping. Free shipping isn't free; the brand absorbs it. On lower-priced products, shipping can be the difference between profit and loss on every order.
Returns. A category with a 30% return rate has a fundamentally different profit profile than one with 5%. Returned orders still incurred the ad spend that generated them — the ROAS got credited, the revenue got reversed.
Discounts. The promo code that drove the conversion comes straight out of margin, but the ad platform reports ROAS on the pre-discount revenue figure.
Contribution Margin Is the Number That Actually Matters
The metric that tells the truth ROAS obscures is contribution margin — the amount left from each sale after all variable costs, including ad spend, are subtracted. Where ROAS asks "how much revenue did this generate," contribution margin asks "how much money did we actually keep." It's the difference between a number that looks good in a meeting and a number that pays the bills.
Calculating it is straightforward: take the revenue from an order, subtract COGS, subtract shipping and fulfilment, subtract payment processing, subtract any discount, and subtract the ad spend that acquired the customer. What remains is the contribution that order makes toward covering fixed costs and generating profit. Run that calculation across a campaign and a very different picture often emerges from the one ROAS paints — campaigns with strong ROAS can have thin or negative contribution margin once high COGS, heavy discounting, or elevated return rates are factored in.
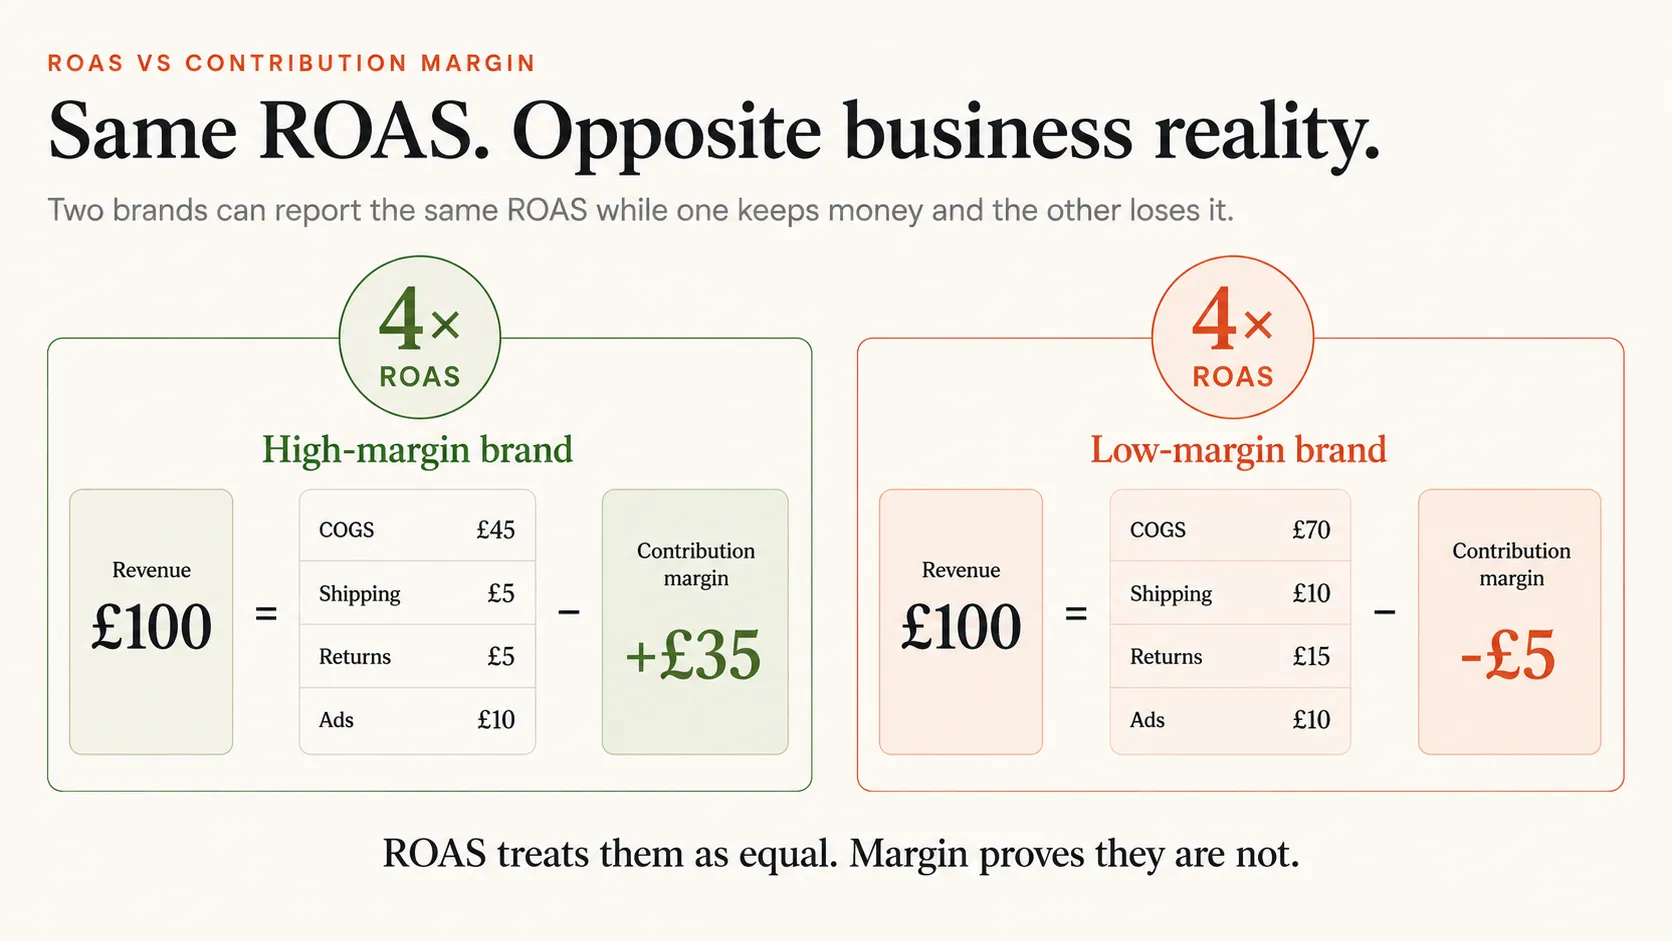
This is also why two brands with identical ROAS can have opposite financial outcomes. A brand selling digital products at 90% margin and a brand selling furniture at 25% margin can both report a 4× ROAS — and one is highly profitable while the other is losing money on every sale. ROAS treats them as identical. Contribution margin reveals that they're nothing alike. The brands that scale profitably are the ones making budget decisions on contribution margin, not on the ROAS number the platform puts in front of them.
Platform ROAS vs Blended ROAS
There's a second layer to the ROAS problem, and it's about attribution rather than cost. The ROAS each ad platform reports is the ROAS that platform claims for itself — and the sum of those claims routinely exceeds reality.
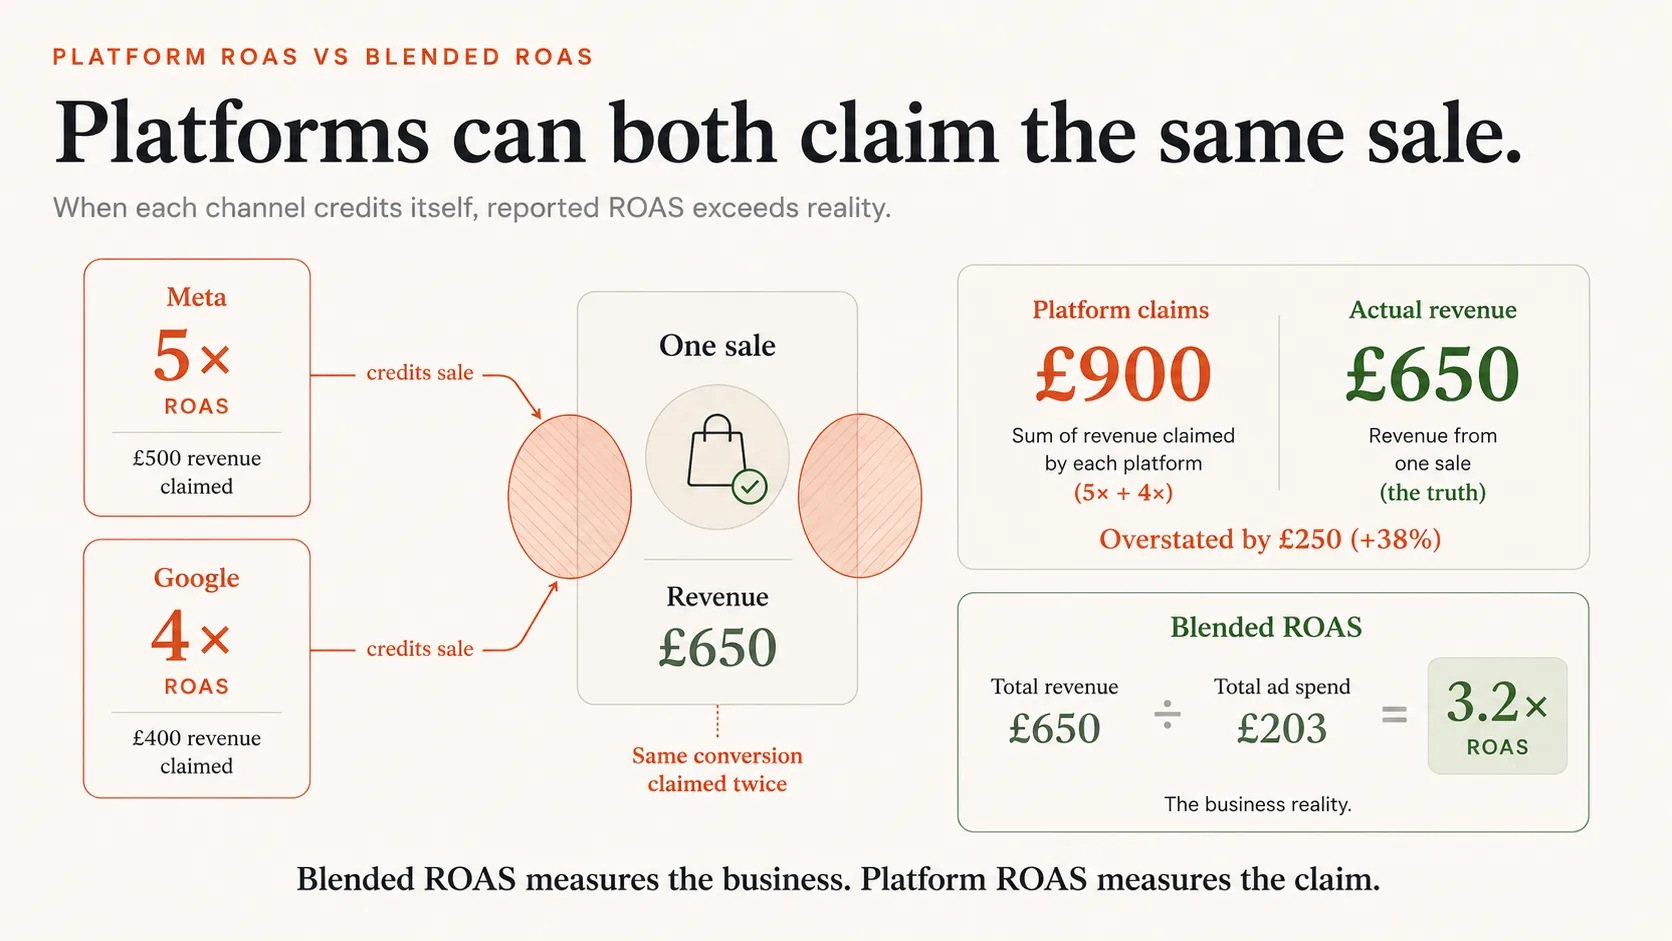
When Meta reports a 5× ROAS and Google reports a 4× ROAS, both are taking credit for conversions using their own attribution windows. A single customer who saw a Meta ad, later clicked a Google ad, and then converted gets counted by both platforms. Add up the platform-reported revenue across every channel and it often exceeds the brand's total actual revenue — which is mathematically impossible and a clear sign that attribution is being double-counted. Each platform is incentivised to claim as much credit as its attribution model allows, because that's what justifies more budget.
Blended ROAS cuts through this. It's calculated simply: total revenue divided by total ad spend across all channels, taken from your own accounting rather than from any platform's dashboard. It can't be inflated by overlapping attribution because it doesn't care which platform gets credit — it only measures whether total advertising is generating proportional total revenue. When platform-reported ROAS looks strong but blended ROAS looks weak, the gap is the inflation. Blended ROAS, combined with contribution margin, is what a brand needs to know whether advertising is actually building the business — and it's the number platform dashboards will never show, because no single platform can claim it.
Why This Pattern Persists
If the ROAS trap is this common, the obvious question is why it keeps happening. Part of the answer is that ROAS is genuinely convenient — it's visible in every platform, updates in real time, and requires no extra calculation. Contribution margin and blended ROAS require connecting ad data to actual cost and revenue data, which takes setup and discipline that many brands never put in place.
The other part is that the incentives of the people reporting the number rarely align with surfacing the problem. Ad platforms report the metric that makes their product look effective. Many agencies report ROAS because it reliably looks good and is easy to present, and because being measured on contribution margin would hold them to a far harder standard. The brand owner, meanwhile, sees a strong number from a credible-looking dashboard and has little reason to suspect that the business can be shrinking while the metric climbs. The result is a system where everyone is looking at a number that flatters the situation, and the actual financial reality stays hidden until cash flow forces the question.
Measure What You Actually Keep
The shift that changes outcomes for e-commerce brands is moving the primary metric from ROAS to contribution margin and blended ROAS. ROAS still has a place as a quick directional signal — it's not useless, it's just incomplete. The mistake is treating it as the headline measure of success when it ignores every cost between revenue and profit and inflates itself through overlapping attribution.
A brand that knows its true contribution margin per order, tracks blended ROAS from its own books, and makes budget decisions on those numbers is operating on reality. A brand optimising toward platform-reported ROAS is optimising toward a number designed to look good — and will keep scaling the campaigns that report best while wondering why more revenue isn't translating into more money. The dashboard isn't lying about the revenue. It's just not telling you the part that actually matters: what you keep.


