
Paid Ads


Vsevolod Hryhorenko
CMO & Co-founder
The Report Looks Great. The Business Isn't Growing
Most paid ads reports are built to look impressive. High impressions, strong click-through rates, low cost per click, a ROAS number that seems healthy — and yet revenue isn't moving, leads aren't converting into clients, and the marketing budget feels like it's disappearing without a clear return. This disconnect is one of the most common frustrations business owners have with paid advertising, and the cause is almost always the same: the report is tracking the wrong things.
Platforms are incentivised to show you numbers that reflect well on their product. Impressions and reach sound significant. Engagement rates feel meaningful. A 4× ROAS looks like success. None of these numbers tell you whether the business is actually profitable from its ad spend — and some of them actively mislead you about how well things are going.
Vanity Metrics vs Signal Metrics
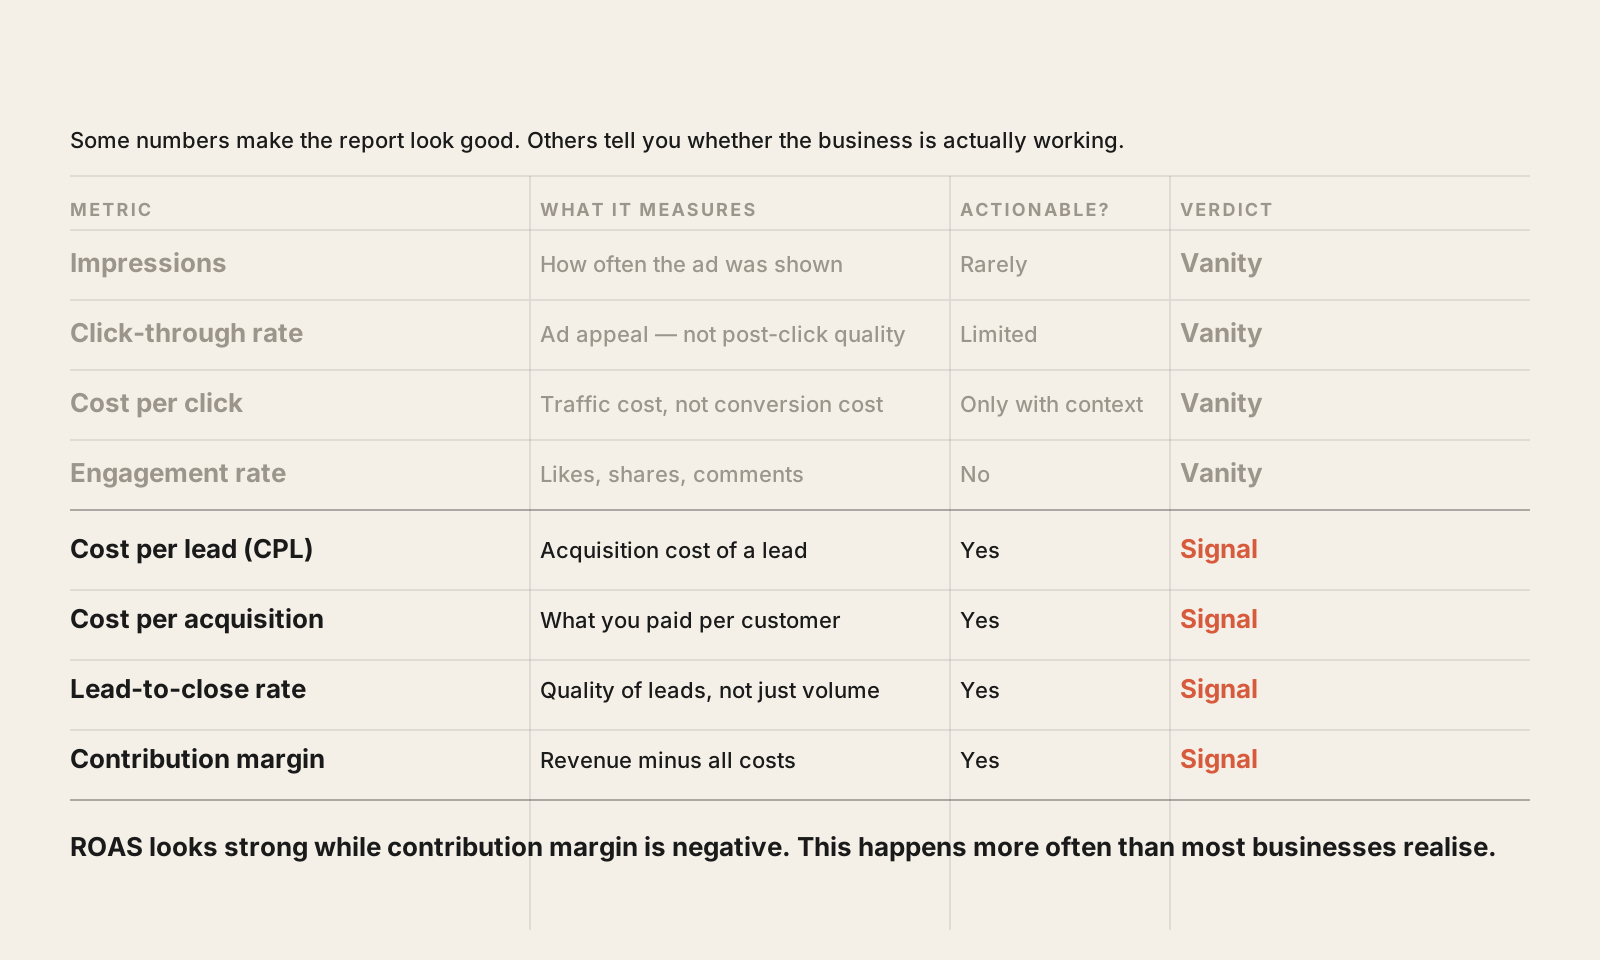
There is a clean distinction between metrics that make a report look good and metrics that tell you whether advertising is working as a business investment. Understanding the difference is the first step to reading any report accurately.
Vanity metrics — visible, but not actionable:
Impressions and reach — how many times your ad was shown and to how many people. Useful for brand awareness context. Meaningless as a performance indicator on its own.
Click-through rate (CTR) — the percentage of people who clicked after seeing the ad. Measures ad appeal. Does not measure what happened after the click.
Cost per click (CPC) — how much each click cost. A low CPC is only good if clicks are converting. Cheap clicks from irrelevant audiences are expensive in practice.
Engagement rate — likes, comments, shares. Relevant for social content strategy. Has almost no relationship to conversion performance.
Video views — platform metrics measure a "view" as little as 2–3 seconds. Aggregate view counts rarely correlate with business outcomes.
Signal metrics — what to actually track:
Cost per lead (CPL) — what you paid to acquire each lead. Directly comparable to your close rate and average deal value.
Cost per acquisition (CPA) — what you paid to acquire each customer. The metric that determines whether the channel is profitable.
Return on ad spend (ROAS) — revenue attributed to ads divided by ad spend. Useful only if revenue is accurately tracked and attributed, and only meaningful in the context of your margins.
Contribution margin per order — revenue minus cost of goods, fulfillment, and ad spend. The actual profitability figure. ROAS can look strong while contribution margin is negative.
Lead-to-close rate — what percentage of leads from ads become paying clients. A low close rate on high-volume leads is a sales problem, not an ads problem, but it changes the economics of the channel entirely.
How Platform Reports Inflate Performance
Even when you're tracking the right metrics, platform-native reports systematically overstate performance in ways that are important to understand before making budget decisions.
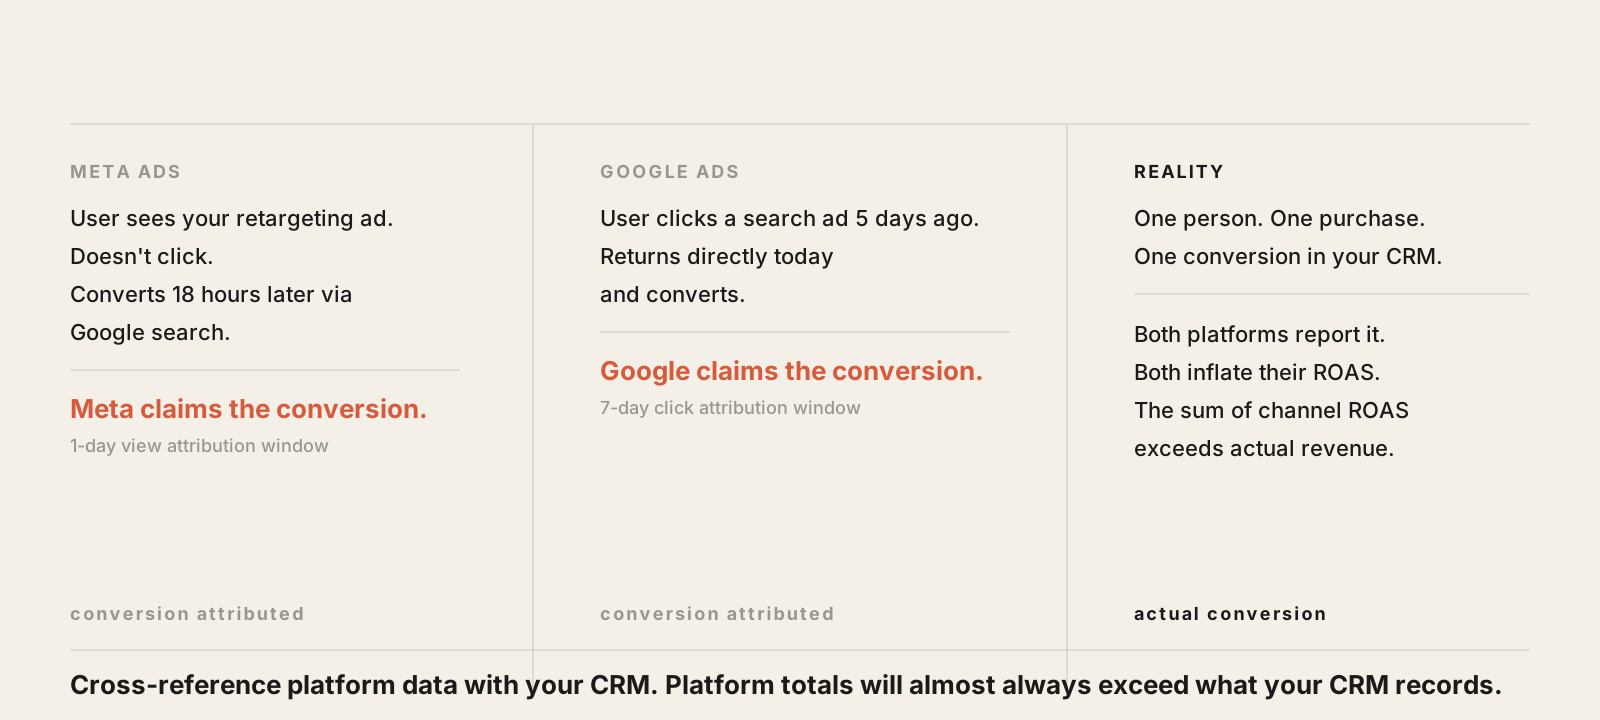
Attribution windows are the biggest source of inflation. A 7-day click, 1-day view attribution window — Meta's default — means that if someone clicks your ad and then converts within 7 days through any channel, the conversion gets credited to your Meta campaign. If someone merely views your ad without clicking, and converts within 24 hours through Google search, Meta still claims credit. The same conversion can be counted by multiple platforms simultaneously, which is why the sum of ROAS across your channels often exceeds what your actual revenue would justify.
View-through attribution is particularly misleading for retargeting campaigns. A user sees your retargeting ad, doesn't click, and converts later — possibly because they were going to convert anyway. The platform attributes the conversion to the ad. This is a meaningful portion of why retargeting always looks strong in dashboards, even when incrementality testing shows the actual lift is much smaller.
Modelled conversions have become more common as browser privacy restrictions limit direct tracking. Platforms use machine learning to estimate conversions they can't directly observe. These estimates are not equally reliable across account types and audience sizes, and they tend to be optimistic.
The practical implication: platform-reported ROAS should be treated as a ceiling, not a floor. The real number is almost always lower. Cross-referencing platform data with your CRM, using consistent UTM parameters, and running periodic incrementality tests gives a more accurate picture of what advertising is actually driving.
What a Useful Report Actually Contains
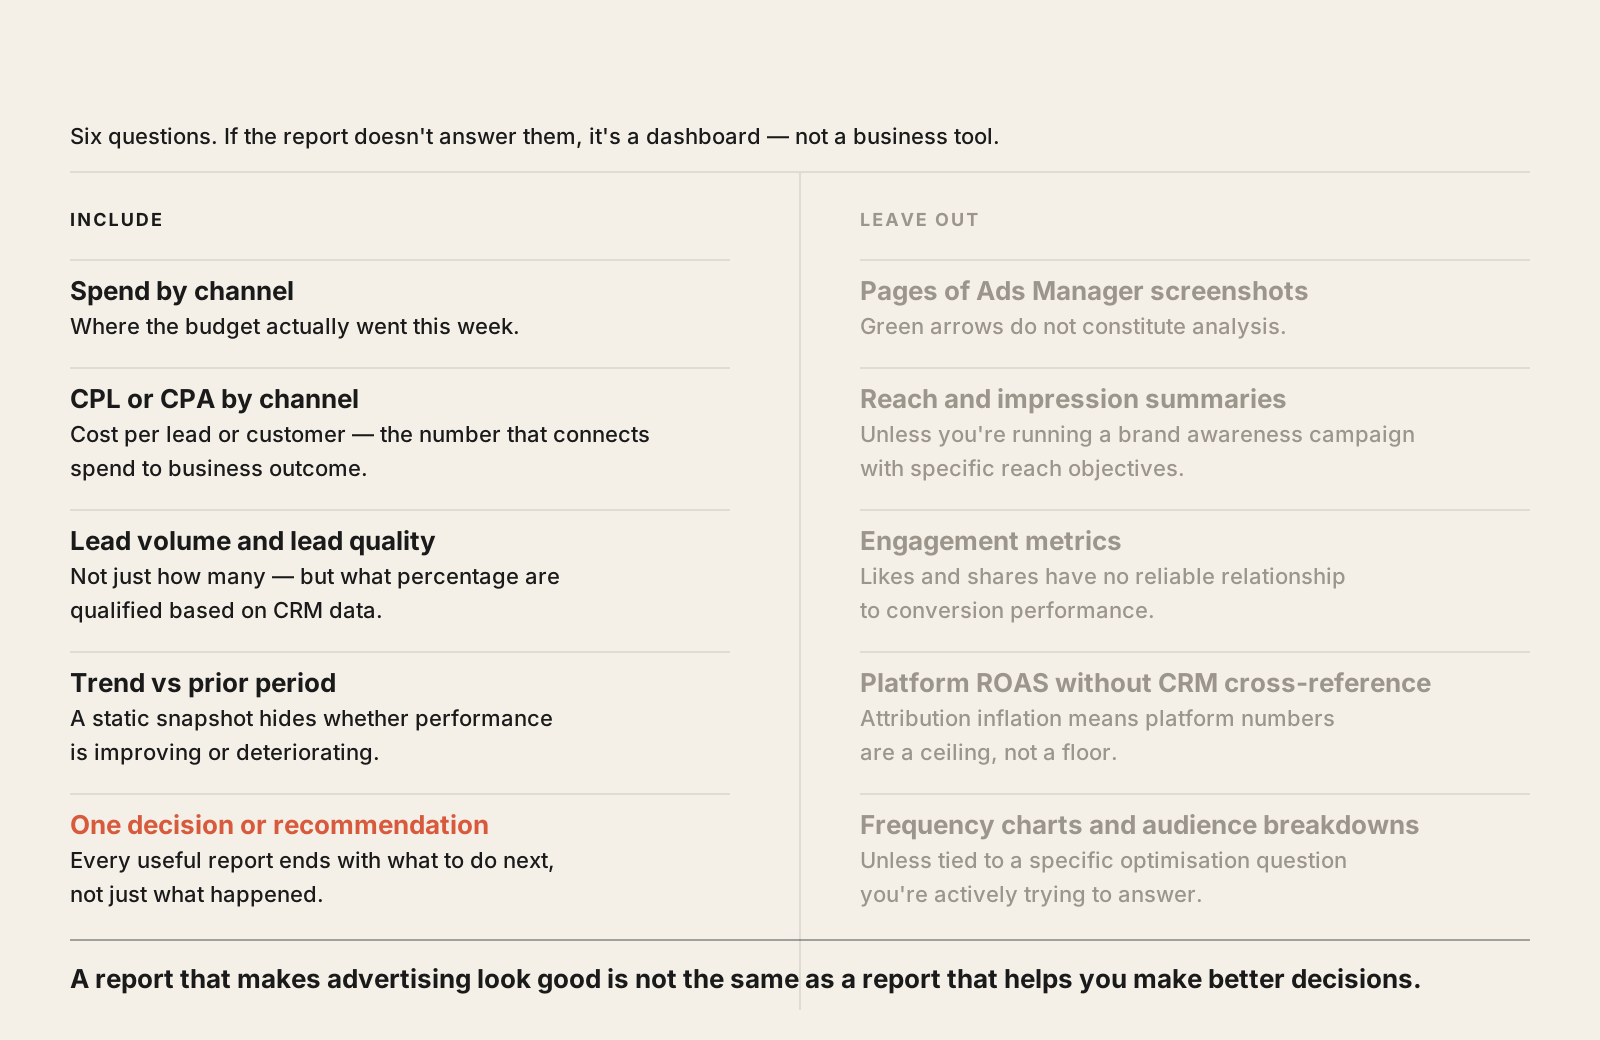
A report that genuinely tells you whether paid advertising is working contains a small number of metrics, compared over time, connected to business outcomes rather than platform activity.
At minimum, a weekly report should show: spend by channel, cost per lead or cost per acquisition by channel, lead volume, and — critically — the quality of those leads as measured by close rate or pipeline value. A campaign generating 50 leads at $20 CPL looks better than one generating 10 leads at $80 CPL until you find out that the $20 leads close at 5% and the $80 leads close at 40%.
Monthly reporting should include contribution margin or some version of actual profitability, not just revenue. It should show trend lines — whether CPL is moving up or down over time — because a static snapshot obscures whether performance is improving or deteriorating. And it should show budget allocation relative to results: if one channel is generating 70% of qualified leads at 40% of spend, that's a reallocation opportunity hiding in plain sight.
What a useful report does not contain: pages of screenshots from Ads Manager showing green arrows, engagement summaries, audience reach breakdowns, or frequency charts — unless those metrics are directly connected to a business decision you need to make.
Questions That Reveal Whether a Report Is Honest
Whether you're reviewing your own account or evaluating what an agency sends you, a short set of questions separates reports that are informative from reports that are designed to look good.
"What is our cost per qualified lead, and how has it moved over the last 90 days?" A qualified lead — not just any form submission — is the metric that connects ad spend to revenue. If this number isn't tracked or isn't in the report, the report isn't measuring what matters.
"What percentage of ad-attributed leads become paying clients?" This requires CRM data alongside platform data. If no one has cross-referenced the two, the report is incomplete.
"What would happen to overall conversions if we paused this campaign for two weeks?" This is an incrementality question. If the answer is unknown, the reported ROAS is based on attribution assumptions that haven't been tested.
"How are conversions being counted — last click, 7-day, view-through?" Attribution model assumptions should be stated explicitly. If a report doesn't mention them, the numbers are harder to interpret accurately.
Good Reporting Is a Business Tool, Not a Scorecard
The purpose of a paid ads report is to help you make better decisions about where to allocate budget and how to improve performance. A report that makes the agency or the platform look good without connecting spend to business outcomes is not a report — it's marketing.
The businesses that get the most consistent value from paid advertising tend to be the ones that have built simple, honest reporting frameworks early: a small number of metrics tracked consistently over time, connected to actual revenue data, with enough context to distinguish between a platform artefact and a genuine performance signal. That's not a complicated system. It's mostly just the discipline to look at the right numbers instead of the ones that are easiest to make look impressive.